How to Analyse Horse Racing Data
A practical guide to analysing horse racing data properly, including form, going, distance, trainer and jockey stats, strike rates, race conditions and statistical patterns.
How to Analyse Horse Racing Data
Horse racing analysis can look complicated from the outside. Form figures, going, distance, official ratings, trainer records, jockey stats, class changes, pace, draw, weight, strike rates, market movement. There is a lot to look at. The mistake many people make is trying to look at everything at once. Good racing analysis is not about collecting as much information as possible. It is about knowing which information matters, how different factors connect, and where a horse may be better or worse suited to today’s race. At RacingStatto, we believe racing data should make the picture clearer, not more confusing. This guide breaks down the main areas to consider when analysing a horse race using data.
Start with the race itself
Before looking at individual horses, look at the race conditions. A horse is not running in isolation. It is running under a specific set of conditions, and those conditions matter. The key things to check are: - Race type - Distance - Going - Class or grade - Field size - Course - Handicap or non-handicap - Flat, jumps or all-weather - Age restrictions - Time since each runner last raced This matters because a horse that looks strong on paper may not be ideally suited to today’s setup. For example, a horse may have good overall form but be unproven over the distance. Another may have strong course form but be running on ground it has never handled well. Another may be moving up in class, carrying more weight, or returning after a long break. The race conditions give context to everything else.
Look at form, but don’t stop there
Form is usually the first thing people look at. That makes sense. A horse’s recent finishing positions can tell you whether it has been running well, struggling, improving or declining. But raw form figures can be misleading. A horse finishing 5th in a strong race may have run better than a horse finishing 2nd in a weak race. A horse may have finished down the field after meeting trouble in running. Another may have been beaten but still run well against a stronger level of opposition. Form needs context. When looking at form, ask: - What level of race was it? - Was the distance similar? - Was the going similar? - Was the horse suited by the pace of the race? - Did it run better than the finishing position suggests? - Was it stepping up or down in class? - Has it run well under similar conditions before? Good analysis is not just “this horse won last time”. It is “what did that performance actually mean?”
Going can change everything
Going refers to the condition of the racing surface. In simple terms, the ground may be fast, soft, heavy, standard, good, or somewhere in between depending on the track and race type. Some horses are much better on quicker ground. Others need cut in the ground. Some handle testing conditions well. Others simply do not act on it. That is why going should never be treated as a small detail. A horse can have strong form overall but perform poorly when the ground changes. Equally, a horse with average recent form may suddenly become more interesting if today’s going matches the conditions it has performed well on before. When analysing going, look for evidence. Has the horse won or placed on similar ground? Has it underperformed when conditions were different? Are its best performances connected to a specific surface or going description? This is where historical data becomes useful. Instead of guessing whether a horse “might” handle the ground, you can look at what has happened before.
Distance matters more than people think
Distance is another major factor. A horse that looks strong over 6 furlongs may not be the same horse over a mile. A horse that stays 2 miles may not have the speed for a sharper race. Some horses are specialists. Others are more flexible. When analysing distance, the question is not just whether the horse has run over the trip before. The better question is: Has the horse performed well over this type of distance under similar conditions? A horse may have tried a distance once and failed because the going was wrong, the race was too strong, or the pace was unsuitable. Another may appear unproven but have breeding, running style or previous performances that suggest the trip could suit. Still, proven performance over similar distance is one of the cleaner signals in racing analysis.
Trainer and jockey data can add useful context
Trainer and jockey stats should not be used blindly, but they can add useful context. A trainer may have a strong record at a certain course. A jockey may have a good relationship with a particular horse. Some trainers do well with horses returning from a break. Others may have strong records with handicap debutants, first-time headgear, course runners or certain race types. The key is not to overreact to one number. A 30% strike rate can look impressive, but if it comes from only 10 runners, the sample is small. A 15% strike rate from hundreds of runners may be more meaningful. When looking at trainer and jockey data, ask: - Is the sample size big enough? - Is the stat relevant to today’s race? - Is the trainer in form recently? - Has the jockey ridden the horse before? - Does the trainer have a pattern with similar runners? - Is the horse being placed in a suitable race? Stats are useful when they are connected to the situation in front of you.
Strike rates need context
Strike rate is one of the most commonly quoted numbers in racing. It simply tells you how often something wins. For example, if a trainer has 20 winners from 100 runners, that is a 20% strike rate. Simple enough. But strike rates can be dangerous if you look at them in isolation. A high strike rate with a tiny sample can be misleading. A lower strike rate with strong profitability or strong place performance may still be valuable. A horse, trainer or angle may have a strong strike rate in one situation but a weak record in another. The better question is not: “What is the strike rate?” The better question is: “What is the strike rate in this specific type of situation?” That could mean: - Same going - Same distance - Same course - Same race type - Same class level - Same trainer pattern - Same data combination This is where racing analysis becomes more powerful. Not by looking at one stat, but by understanding how different stats work together.
Look for combinations, not isolated stats
One of the biggest mistakes in racing analysis is relying on one data point. A horse has good form. A trainer is in form. A jockey has a strong record. The horse likes the ground. Any one of those things can be useful, but none of them should be treated as enough on their own. The stronger signal often comes when several relevant factors align. For example: - The horse has strong recent form - It has proven performance over the distance - It has acted on similar going - The trainer has a good record in this race type - The jockey has previous success with the horse - The horse ranks well against today’s field - The historical data supports the combination That does not mean the horse will win. Racing does not work like that. But it may suggest the runner is statistically interesting. At RacingStatto, this is a big part of how we think about data. We are not trying to replace judgement. We are trying to surface the runners where the strongest historical signals are lining up.
Be careful with opinions
Horse racing is full of opinions. Some are useful. Some are not. The problem with opinion-led analysis is that it can become emotional very quickly. People remember the winners, forget the losers, chase narratives, or become attached to a horse because of one previous run. Data helps keep things grounded. It does not remove uncertainty. It does not guarantee outcomes. It does not make racing easy. But it does give you a more structured way to approach a race. Instead of asking “who do I fancy?”, you can ask: - Which runners are best suited by today’s conditions? - Which runners have performed well in similar situations before? - Which runners are being overrated or underrated? - Which historical patterns are strongest? - Which horses are ranking well across multiple areas? That is a much healthier way to analyse racing.
Don’t confuse data with certainty
This is important. No racing data platform can tell you what will definitely happen. Horses are living animals. Races are unpredictable. Ground can change. Pace can collapse. A horse can miss the break, get blocked, jump poorly, fail to settle or simply have an off day. Good data does not remove risk. It helps you understand it. The goal is not to find certainties. The goal is to make better-informed decisions over time. That is why long-term thinking matters. One race means very little. A small sample can be noisy. The value of racing data is seen across patterns, repeated situations and larger sets of results.
A simple horse racing data checklist
Before making a judgement on a race, it helps to work through a simple structure. Ask yourself: 1. What are today’s race conditions? 2. Which horses are proven under similar conditions? 3. Which runners have strong recent form? 4. Which horses are suited by the going? 5. Which horses are suited by the distance? 6. Are any runners moving up or down in class? 7. Are trainer and jockey stats relevant? 8. Is there enough sample size behind the stats? 9. Are multiple positive factors lining up? 10. Does the price or market reflect the data? That final point matters. A horse can be statistically strong but still be poor value if the market has already fully accounted for it. Equally, a horse may not look obvious at first glance but become interesting when several overlooked data points align.
How RacingStatto helps
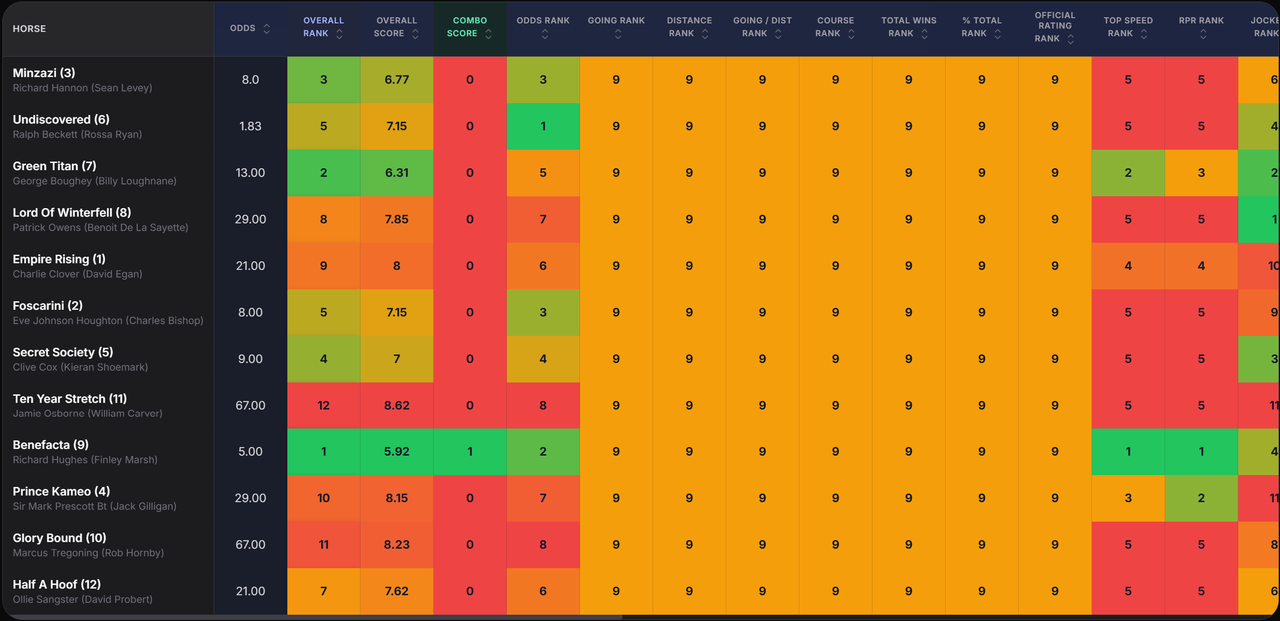
RacingStatto was built to make this process quicker and clearer. Instead of forcing users to dig through endless tables, spreadsheets and scattered racecards, the platform brings key racing data into one place and presents it in a clean, structured way. The aim is not to tell users what to bet. The aim is to help users see: - Which runners rank strongly - Which horses match important historical patterns - Which data combinations are standing out - How runners compare within the same race - Where the strongest statistical signals may be It is racing analysis built around data, not hype.
Final thoughts
Analysing horse racing data properly is not about finding one magic number. It is about context. A horse’s chance can be shaped by form, going, distance, class, pace, course, trainer, jockey, weight, draw, race conditions and how all of those factors interact. The more structured your analysis becomes, the less you rely on guesswork. That is the real value of racing data. Not certainty. Clarity.